← netplot · compared
Netplot vs draw.io for network documentation
Short answer: draw.io (diagrams.net) is an excellent free general-purpose diagramming tool, and if all you need is a picture of your network, use it — it costs nothing. Netplot is a network documentation tool: the boxes know their ports, IPs and VLANs, the file prints an engineering-grade PDF, and the same file doubles as a live monitoring wallboard. This page lays out the difference honestly.
What draw.io does well
- Free and open source — no license to buy, ever.
- Universal — flowcharts, org charts, cloud architecture, anything with boxes and arrows.
- Huge shape libraries — including Cisco and generic network stencils.
- Works offline in the desktop app; files are portable XML.
If your network diagram is a one-off illustration for a slide deck or a wiki page, stop reading — draw.io is the right tool.
Where a diagram stops being documentation
The problems start when the drawing has to serve as the operational record of a network:
- Ports are just labels. In draw.io, "port 14 → AP terrace, VLAN 20" is a text box you maintain by hand, per port, per switch. There is no port model, no search, no per-device port table.
- The deliverable is a picture. Clients and auditors expect port tables, IP schema, revision history — a document, not a screenshot.
- It never reflects reality. A diagram cannot tell you a link is saturated or down. The day after handover it starts drifting from the real network.
What Netplot does instead
Netplot treats the map as a database that happens to be drawn:
- Port-level model: every device has a port map — what's connected, which VLANs, which IP. Searchable, printable, stored inside the file.
- Engineering PDF: one click produces a title block, revision table, the topology, and full per-device port tables with a VLAN column. The deliverable that justifies an integrator's invoice.
- The map is the monitoring: a tiny SNMP collector (Python, runs on a €40 Raspberry Pi) lights every link with live load, status and VLANs. Full-screen wallboard, DOWN alarms with sound.
- Client hand-off: one command builds a read-only viewer copy for your end client — nothing they can break, your name in the footer.
- One file, forever: a single HTML file. No cloud, no install, no account, no telemetry. It runs from a USB stick on an air-gapped network.
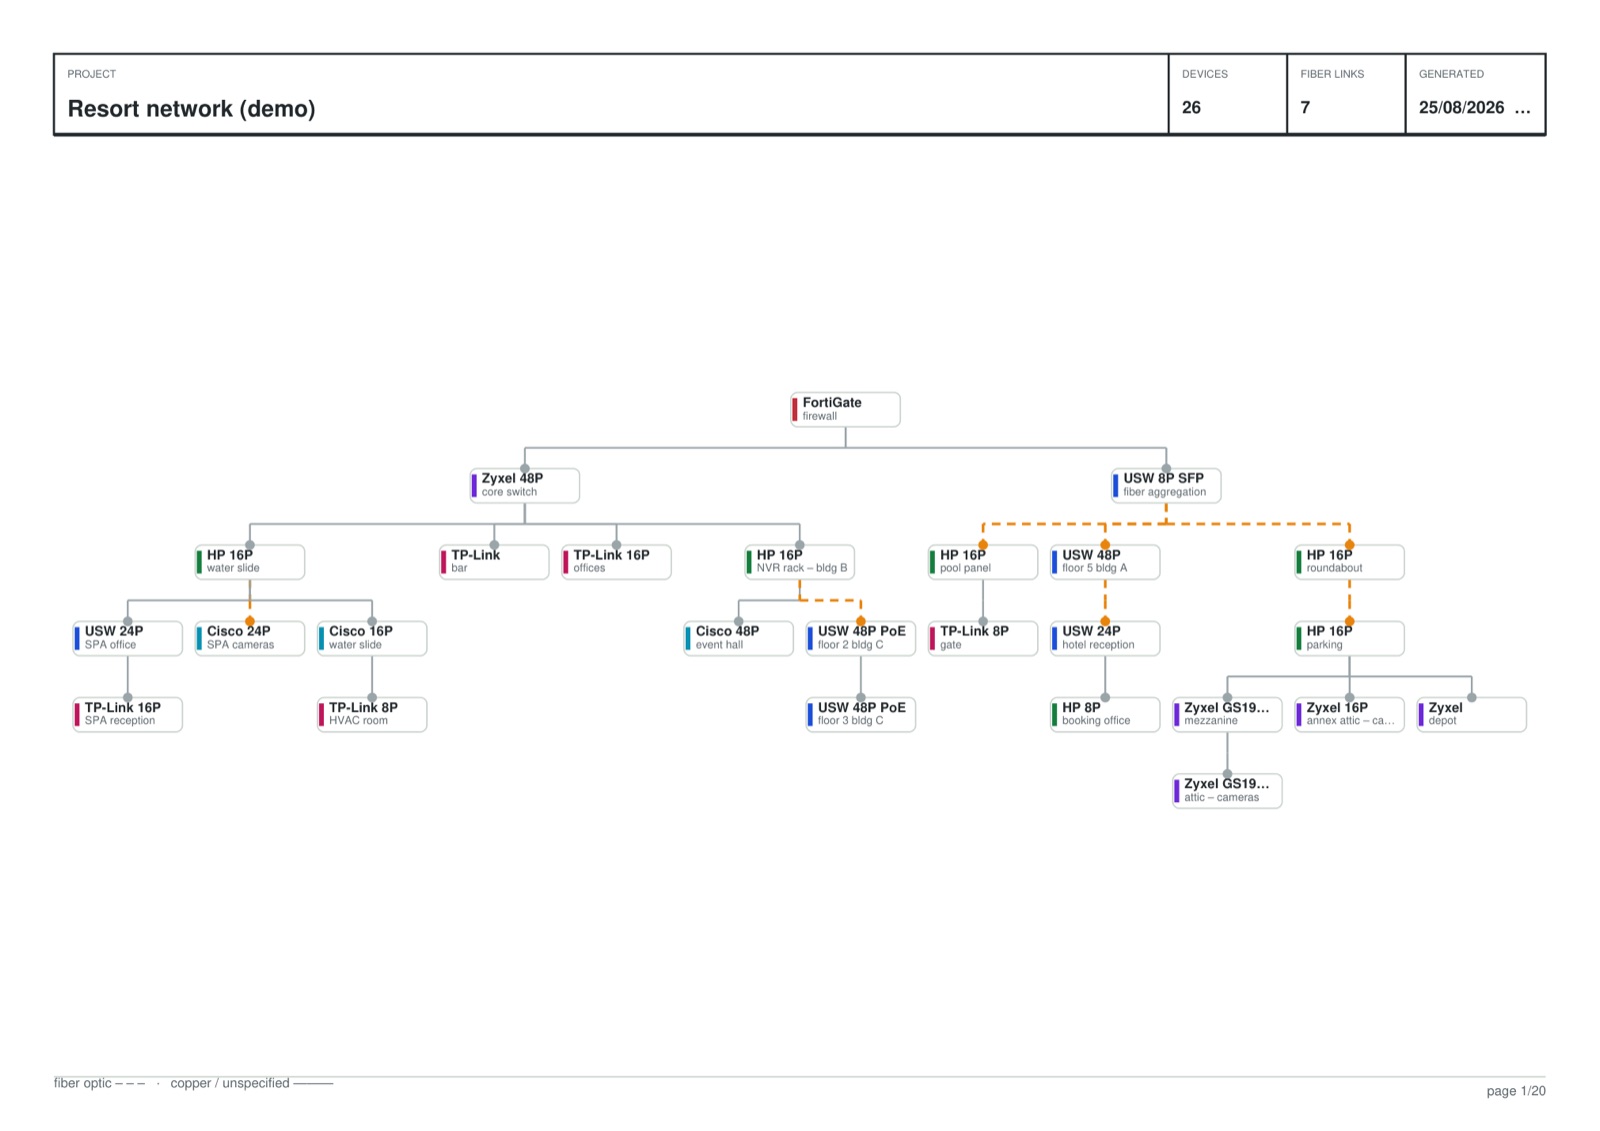
Side by side
| Netplot | draw.io / diagrams.net | |
|---|---|---|
| Price | €79 once (perpetual) | free, open source |
| General diagramming (flowcharts, org charts…) | no — networks only | yes |
| Port & VLAN documentation | built-in model | manual text boxes |
| Engineering PDF with port tables | one click | no |
| Live traffic / wallboard / DOWN alarms | yes (SNMP collector) | no |
| Read-only client viewer builds | yes | no |
| Works fully offline | yes — one HTML file | desktop app: yes |
| Uplink model with auto layout | yes | manual arrows |
The honest verdict
Choose draw.io if you need a free drawing of a network for a presentation or wiki, or if you diagram many things besides networks.
Choose Netplot if the network map is a deliverable you hand to a client, an operational record you search when something breaks, or a screen you want on the server-room TV showing what is actually up. That's the job it was built for — and the only job it does.
You can verify all of this without trusting this page: the demo below the fold at netplot.app is the real product running in your browser with simulated traffic, and the trial is the full product limited to 15 devices.